 NEW YORK, USA – A higher GDP doesn’t guarantee shared benefits or sustainable growth. To better measure real progress, UNCTAD combines it with data on living conditions, equality and the environment.
For nearly 80 years, gross domestic product (GDP) has been the go-to measure of prosperity. But higher economic output doesn’t guarantee shared benefits or sustainable growth.
To paint a fuller picture, UN Trade and Development’s (UNCTAD) Inclusive Growth Index combines GDP with other data on living conditions, equality and environmental sustainability. Launched in 2022 and expanded this year, the index now covers 134 countries representing 95 percent of the world’s population and 97 percent of global GDP.
New data released on 10 March shows that while major disparities persist, some gaps are narrowing, and lines are blurring.
Developed economies still score nearly twice as high on inclusive growth
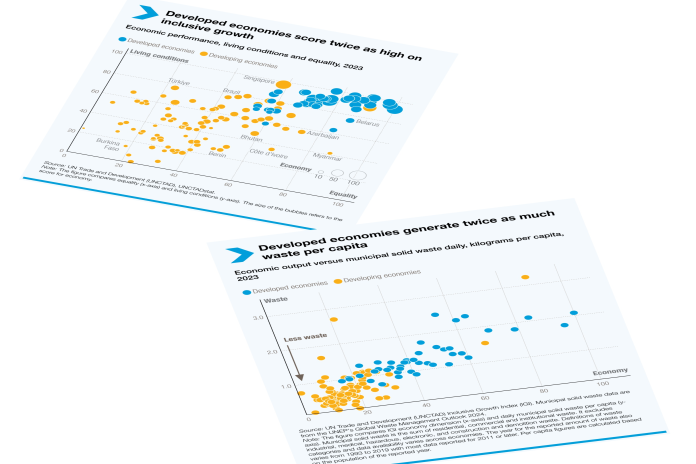
In general, more economically advanced countries are achieving more inclusive growth. On average, developed economies score nearly double that of developing ones on the index.
Luxembourg, Norway and Denmark continue to lead, with only two developing economies – Singapore and the United Arab Emirates (UAE) – in the top 30.
Developing economies show progress in closing gaps
A closer look reveals strong performances by some developing economies.
Singapore, for example, outperforms many developed economies in living conditions, scoring 97.1. Similarly, Chile, China, Thailand, the UAE and Uruguay all score above 80 – much closer to the developed economy median (89.3) than the Global South’s (46.4).
On equality, developing countries like the UEA (91.4), Belarus (87.4), Azerbaijan (73.7) and China (71.4) surpass or match the developed economy median (73.5), far exceeding the 37.4 median for developing economies.
The equality component measures how evenly opportunities and benefits are shared across a country’s population, focusing on whether different groups – especially women and youth – have equal access to resources, jobs and decision-making. It draws on 10 indicators covering income, poverty, education, employment and political representation.
The index highlights the urgent need to break the link between economic growth and resource consumption and waste. Developed economies generate about twice as much waste per capita as developing ones.
For example, Luxembourg, a top economic performer, produces an estimated 760 kilograms of municipal solid waste per person each year – over 2 kilograms a day. In contrast, the Lao People’s Democratic Republic, a least developed country, generates just 50 kilograms per person annually, or about 0.15 kilograms per day – the weight of an apple.
This means the average person in Luxembourg produces over 15 times more waste than someone in Lao PDR. In general, least developed countries and small island developing states have the lowest per capita waste rates.
While economic growth and urban density generally lead to more waste, Japan and the Republic of Korea (South Korea) show that effective management is possible.
Environmental sustainability varies widely across regions
Developed economies lead in sustainability, thanks to stronger policies and better infrastructure. However, their scores reveal a wide range of performance levels within the group.
Some developing economies are catching up. Singapore (66.5), Panama (54.4) and the Dominican Republic (52.3) are closing the gap with Ireland (71.1), Denmark (70.0) and the United Kingdom (68.0), particularly in energy efficiency and carbon management.
Meanwhile, regional differences across the Global South reflect varying challenges.
Latin America and the Caribbean, with the median of 41.8, perform slightly better than other developing regions but struggle with limited investments in green infrastructure and high reliance on fossil fuels.
Africa (40.2) shows a wide range of performances, with some countries advancing while others struggle due to uneven policies and resource constraints. Asia and Oceania (30.8) face significant sustainability challenges.


